
How to Build the Business Case for GTM Content Automation
You've felt the pain long enough to know the answer. Your team spends 20-plus hours per release manually producing content that's already stale by the time it ships. Half your features never get communicated to the market. Your sales team is losing deals on capabilities you built six months ago because no one updated the battle card.
You know GTM content automation is the fix. The problem isn't conviction. It's the meeting you have to walk into next Tuesday with Finance, IT, and your CMO, each of whom has a different reason to say no, and none of whom feel the daily friction the way your team does.
This post is a playbook for that meeting. How to quantify the cost of doing nothing, structure the ROI calculation, handle the objections you will face, and frame the case for each stakeholder so they hear what they actually care about. Not a generic framework. A specific, usable guide for getting GTM content automation approved.
Contents
Step 1: Quantify the Cost of the Status Quo
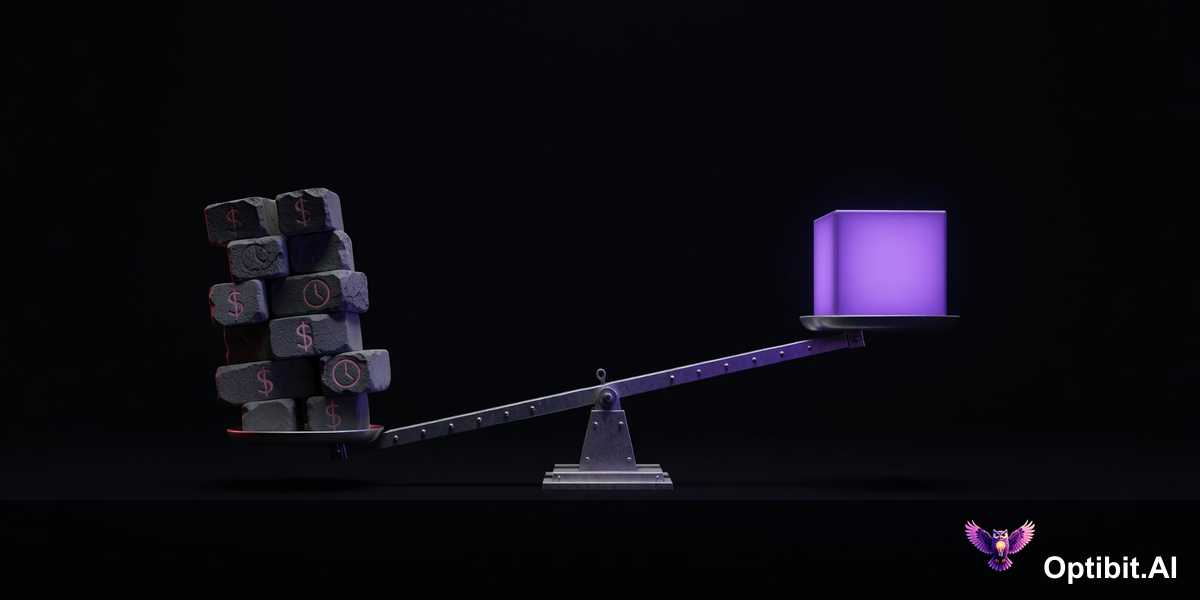
Every business case starts with the same question: what does the problem cost right now? Most champions skip this step, or answer it vaguely. "We're spending too much time on content." That is not a business case. That is a complaint. Finance needs a number.
Here is how to build the number. Start with a single release. Map every artifact your team produces for it and who produces it. Then apply loaded hourly cost rates. The output is the true cost of one release, which you can then multiply by your annual release cadence.
| Artifact | Owner | Avg. Hours | Loaded Cost (at $100/hr) |
|---|---|---|---|
| External release notes | PMM | 3 hrs | $300 |
| Internal changelog | Engineering | 2 hrs | $200 |
| Customer announcement email | Marketing | 2.5 hrs | $250 |
| LinkedIn / social post | Marketing | 1 hr | $100 |
| Battle card update | PMM + Sales | 3 hrs | $300 |
| Support KB article | Support | 2 hrs | $200 |
| API changelog | Engineering | 2 hrs | $200 |
| Sales talking points | PMM | 2.5 hrs | $250 |
| Total per release | 18 hrs | $1,800 |
At two releases per month, that is $3,600 in direct content production cost. At weekly shipping, it is $7,200 per month, or $86,400 per year. Those are conservative estimates that assume every artifact gets produced and every hour is spent efficiently. In practice, the reality is worse: context-switching overhead, revision cycles, cross-team coordination, and the artifacts that simply never get made because the team ran out of time.
Use your actual numbers. Adjust the hourly rate for your market and seniority mix. Use your real release cadence. The specific figure matters less than having a specific figure. "We spend roughly $85,000 per year on manual GTM content production" is a business case opener. "We spend a lot of time on this" is not.
Step 2: Surface the Hidden Costs
Direct labor hours are only part of the cost. The harder-to-quantify costs are often larger. They are also more persuasive, because they connect to outcomes executives already track.
The coverage gap cost. Approximately 50% of shipped features never receive customer-facing communication. For a company shipping $10M in annual product investment, that means $5M worth of engineering work is invisible to the market. What is the value of a feature no one knows exists? Zero, for the customer who would have renewed or expanded based on it. Near-zero, for the prospect who would have bought if they knew.
The lag cost. The median time from a feature shipping to the first customer-facing content about it is 23 days. For 23 days, your sales team is selling last quarter's product. Your support team is fielding questions about features without current documentation. Your prospects are forming opinions based on outdated information. Each of those 23 days is lost sales cycle time, inflated support cost, and compounding perception lag.
The content decay cost. Sales battle cards go stale. Support KB articles fall behind. Customer-facing documentation describes features that have changed. Stale content doesn't sit quietly. It actively damages deals, inflates support tickets, and erodes the customer's confidence in your product's quality. The cost of maintaining that content manually grows with every release. The cost of not maintaining it is measured in churn and lost revenue.
The opportunity cost. Every hour a PMM spends writing release notes from a PR description is an hour not spent on competitive strategy, customer research, or campaign development. GTM content production is high-cost, low-leverage work for your most expensive people. Automation returns that capacity for work that actually requires human judgment.
Step 3: Build the ROI Calculation
With the cost of the status quo established, the ROI calculation is straightforward. You need three inputs: current annual cost, projected cost with automation, and the platform investment.
A worked example for a mid-market SaaS team shipping twice per month:
| Line item | Current state | With OptibitAI |
|---|---|---|
| Direct content production hours/year | 432 hrs (18 hrs x 24 releases) | ~90 hrs (review only) |
| Direct labor cost/year | $43,200 | $9,000 |
| Coverage rate (features communicated) | ~50% | ~100% |
| Avg. time to first customer-facing content | 14–21 days | Same day |
| Platform investment | $0 | Platform fee |
| Net annual savings (labor alone) | $34,200+ |
That calculation covers only the direct labor savings. It does not assign value to the coverage gap closure, the lag reduction, or the opportunity cost recovery. Each of those adds to the numerator. Present the conservative case (labor only) and then note that the full value is materially higher when those factors are included. Finance appreciates conservative projections with upside identified rather than aggressive projections with no room for credibility.
OptibitAI includes a built-in ROI calculator that lets you enter your specific release frequency, team size, and average hourly rate. Use it to generate your own numbers before the meeting. Showing stakeholders a calculation built on your actual inputs is more credible than any benchmark figure.
Step 4: Frame It for Each Stakeholder
The same business case lands differently depending on who is hearing it. Finance, Marketing leadership, Engineering, and IT Security each have different primary concerns. Presenting the same slide deck to all of them produces the same result: someone in the room isn't convinced. Frame the core argument for each audience.

Step 5: Handle the Objections in Advance
Every new platform purchase faces a predictable set of objections. Walking into the meeting with prepared responses to each one signals credibility and accelerates the decision.
Step 6: Structure the Ask
A strong business case ends with a specific, low-friction ask. Vague asks produce vague responses. "We'd like to explore this" produces "let's revisit next quarter." A clear ask with a clear next step produces a decision.
The most effective structure for a platform evaluation ask has three components: a pilot scope, a success metric, and a decision timeline.
Pilot scope. Propose a defined pilot: one team, one quarter, a set number of releases. Limit the scope to something that feels manageable and reversible. "I'd like to pilot this with the marketing team on our next four releases" is a yes-able ask. "I'd like to deploy this across the organization" is not.
Success metric. Define what success looks like before the pilot starts. Content production hours per release. Time from release to first customer-facing artifact. Coverage rate across artifact types. Stakeholder satisfaction with output quality. Pick two or three metrics that are measurable and that connect to outcomes the business already tracks. Committing to measurement signals confidence and gives the evaluation a clear endpoint.
Decision timeline. Specify when you will report back and what the decision criteria are. "At the end of the quarter, if we have reduced content production time by 50% or more and maintained quality, I will bring a full deployment recommendation." A defined decision point prevents the pilot from drifting into indefinite evaluation limbo.
The business case for GTM content automation is not a hard one to make. The cost of the status quo is real, measurable, and growing with every release cycle. The ROI is calculable from first principles. The security and compliance requirements are met. The objections are answerable.
The only thing standing between your team and the system that closes the content gap is the meeting. Run the numbers, frame the conversation for each stakeholder, and walk in with answers ready. The math is on your side.
Start building your ROI calculation and schedule a demo at optibit.ai.